mPower Community Gallery Designs

mPower is a free innovative gaming tool that engages students from kindergarten to grade 6 to learn math both in the classroom and at home. It integrates science, arts, social studies, technology, engineering and math (STEM) and encourages students to enhance their problem-solving and critical thinking. The mPower Educator Dashboard allows teachers and other educators to monitor their students’ performance through assessments that address each of students’ personal learning goals and needs while corresponding with the Ontario curriculum.
An interactive community gallery that encourages students to share their learning competencies in the classroom with their educators for assessment

Platform
Responsive web:
Desktop
Tablet
Company
TVO
Project duration
Sept. 2017 – Mar. 2018
Tools used
Axure
Sketch
InVision

The challenge
Initially, mPower was launched because it was designed to resolve the declining math scores in Ontario for students ranging from Kindergarden to grades 6. After mPower launched publicly at an MVP level, our team received feedback from educators about the previous version of the mPower student community gallery. They requested assessments where they can see how their students are applying their math skills socially around their peers after playing the games. In this iteration, we focused on:
“How might we allow educators to adapt and accommodate their student’s needs and find ways to improve the social interaction of students with their peers when applying their creativity and their learning after playing the games?
The goal
The goal of this initiative was to design dashboards that allowed:
A.) Educators to accommodate their students’ learning needs
B.) Students are to share their community gallery postings with their peers based on their applied learning and creativity after playing the games.
Metrics (KPIs) considered
Success task rate:
When students share their posts, as well as submit comments in the class gallery.
Engagement:
To ensure students show interest in applying their learning as well as confidently share their feelings with their peers.
Conversion rate and maintaining active/returning users:
After educators and students sign up for an account online, TVO needs to ensure they are using the product on a regular basis.
User satisfaction:
If tutors and students are satisfied with this product, it is highly likely they would recommend it to other schools in Ontario, which in turn helps boost the conversion rate. Also, user satisfaction indicates that students are finding the platform enjoyable to use as it meets their learning goals and boosts their confidence.
End-users
mPower targets students from kindergarten to grade 6, including teachers and other educators whose role is to assess their students’ performance while playing the games.
My role and process
My role in the team
I led the design experience and visual designs from the conceptual stages to end product delivery while collaborating with a large team of Ontario-certified educators, TVOKids team (game artists, designers and writers) developers, and the product team (product manager, business analysts/content strategists and quality assurance analysts).
1 - Discover
Field studies encouraged deep empathy with students to inform better assessments for educators
After I understood the requirements requested by our stakeholders, as well as the concerns addressed from both educator and student standpoints, I worked with my team to tackle this by first empathizing with our students. We attended a local public school where we conducted surveys by having one-on-one conversations with students from different grades levels ranging from grades 3-6 and observed their activity and behaviour as they played the games. In this research session, we learned about their behavioural patterns that related to personal interests in arts and crafts from playing the mPower community gallery games with their peers. We, too, experimented with ways and habits of expressing their sentiments using emoticons.
Our key learnings indicated that students:
Knew how to interact with emoticons because they represent real-world actions and are representations of the digital age and social environments that the kids are living in today. (*1)
Are encouraged to share their work when their peers do so. As opposed to feeling nervous and excluded when posting on their own, students feel confident, fulfilled, and most importantly happy when they get the opportunity to look at the artwork of others.
Are passionate working towards being challenged by their creativity and experimentation because they can develop their imagination and curiosity while learning.(*2)
Integrating feedback with a competitor analysis to better frame the problem
The data collected from my research and stakeholder meetings informed me to consider opportunities that can make the platform more intuitive for both students and educators to use. Looking at our competitors even got us inspired for designing assessment reports that are relevant to the educator’s pedagogical needs of meeting the Ontario curriculum. For weighing the advantages and disadvantages of our current platform, a competitor analysis of student games proved useful at this time as Community Gallery was a value proposition that allowed mPower to stand out against its competition.
Competitor analysis: How can mPower stand out from the rest of its competitors

2 - Define
Applying our findings into continuously improving the Community Gallery experience for both our students and educators
After evaluating all of the findings compiled from our research, we shared our observations, as well as discussed our business goals and requirements with our stakeholders to define our scope of our Community Gallery assessment. Later, I met with the game designers and developers to define our requirements necessary for us to ideate possible solutions for designing the educator Community Gallery assessment and improving the current student gallery experience.
3 - Design
User flow mapping clarified the logic of our proposed solutions to stakeholders, illustrators and developers
Before I started on the wireframes, I needed to understand how our users can interact with both existing and planned features so that we can provide maximized usability when our students and educators can take full advantage of mPower Community Gallery experience. Before jumping into designing the wireframes, the user-flow helped me clearly understand and explain the logic and flow of our proposed solutions to our stakeholders, illustrators and developers. While working on this flow, I repeatedly read and reviewed the user stories and my notes from the discussions that I had with our stakeholders to ensure the requirements met their approval before we went out to conduct usability testing with students.
User flow: Community Gallery student postings and reflections and Educator Assessments

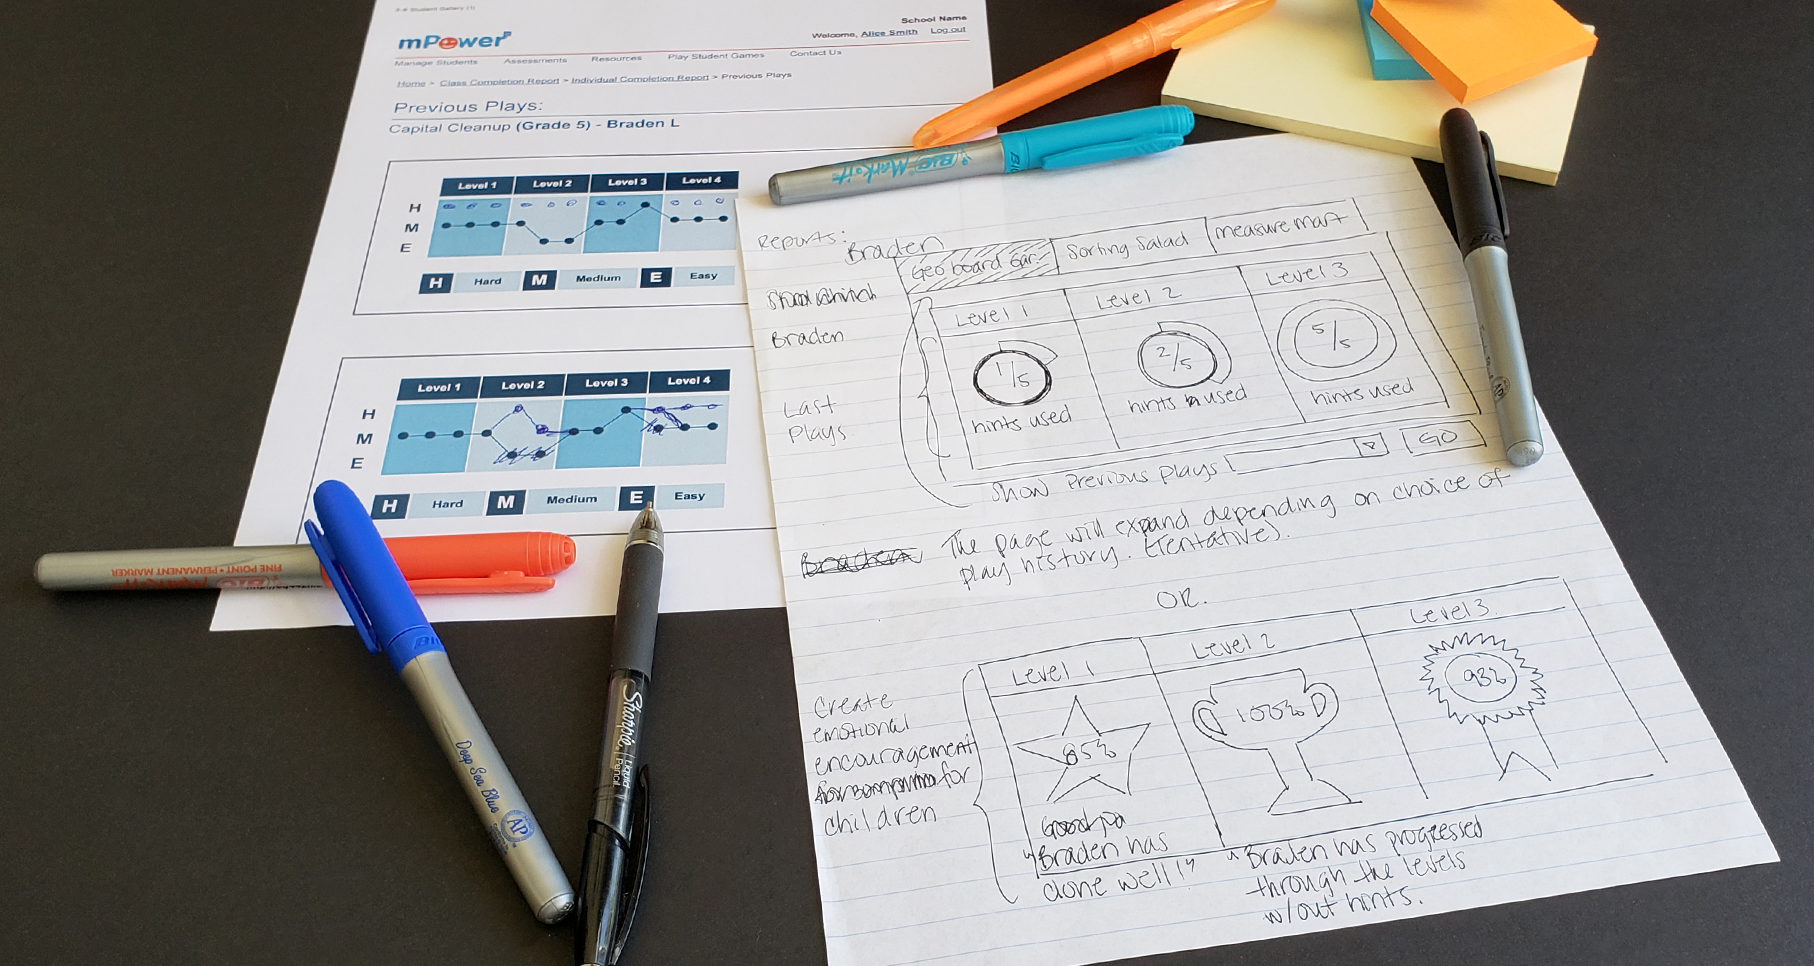
Conceptual sketches established logic when students interact with their peers for a meaningful educator assessment experience
To apply the defined requirements requested from my stakeholders along with the observations of our users’ behavioural patterns and defined user flow, I quickly drew out some sketches of our concept. When designing for the Student Gallery, they illustrated variations of how students can start their conversations by combining emoticons with either pre-made sentences or customized text. These illustrations better informed the educator’s assessment experience because they can get a sense of how the conversations are going when students interact with their peers about their work.
Conceptual sketches: when educators assess their student’s interactions with their peers using the Community Gallery
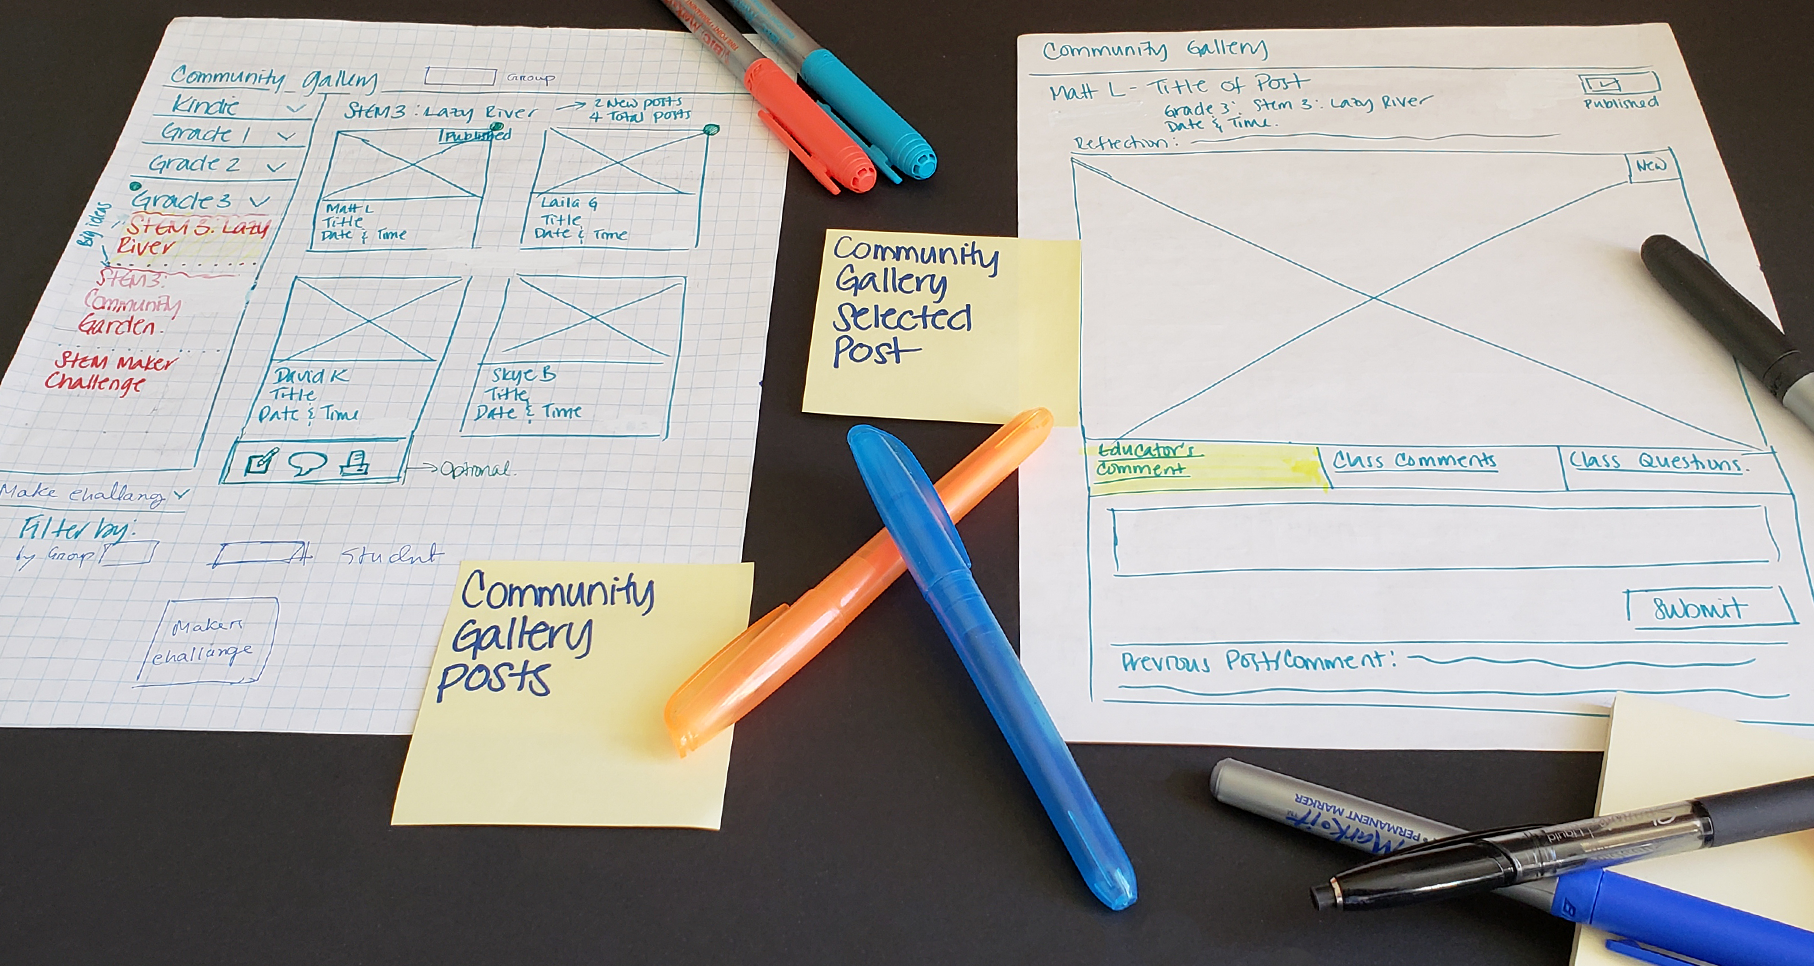
Conceptual sketches: when students use a combination of emoticons, pre-made sentences & text in their gallery
Interactive wireframes established better understanding with stakeholders & the team
I took the sketches, user-flow diagram and the feedback from the end-users and stakeholders to bring these to life with interactive wireframes. I was able to closely work with my team and stakeholders to explain the concepts of my designs and established a better understanding when I received constructive feedback to inform and guide the game illustrators (from the TVOKids department) of using their artistic talents into designing the hi-fidelity mockups for the Student Community Gallery.
High-fidelity mockups: Educator Assessments for Community Gallery
1.0 - Assessments: Community Gallery Class Postings
The user sees the students’ Community Gallery posts. They can filter the gallery by grade, game, group and student name.

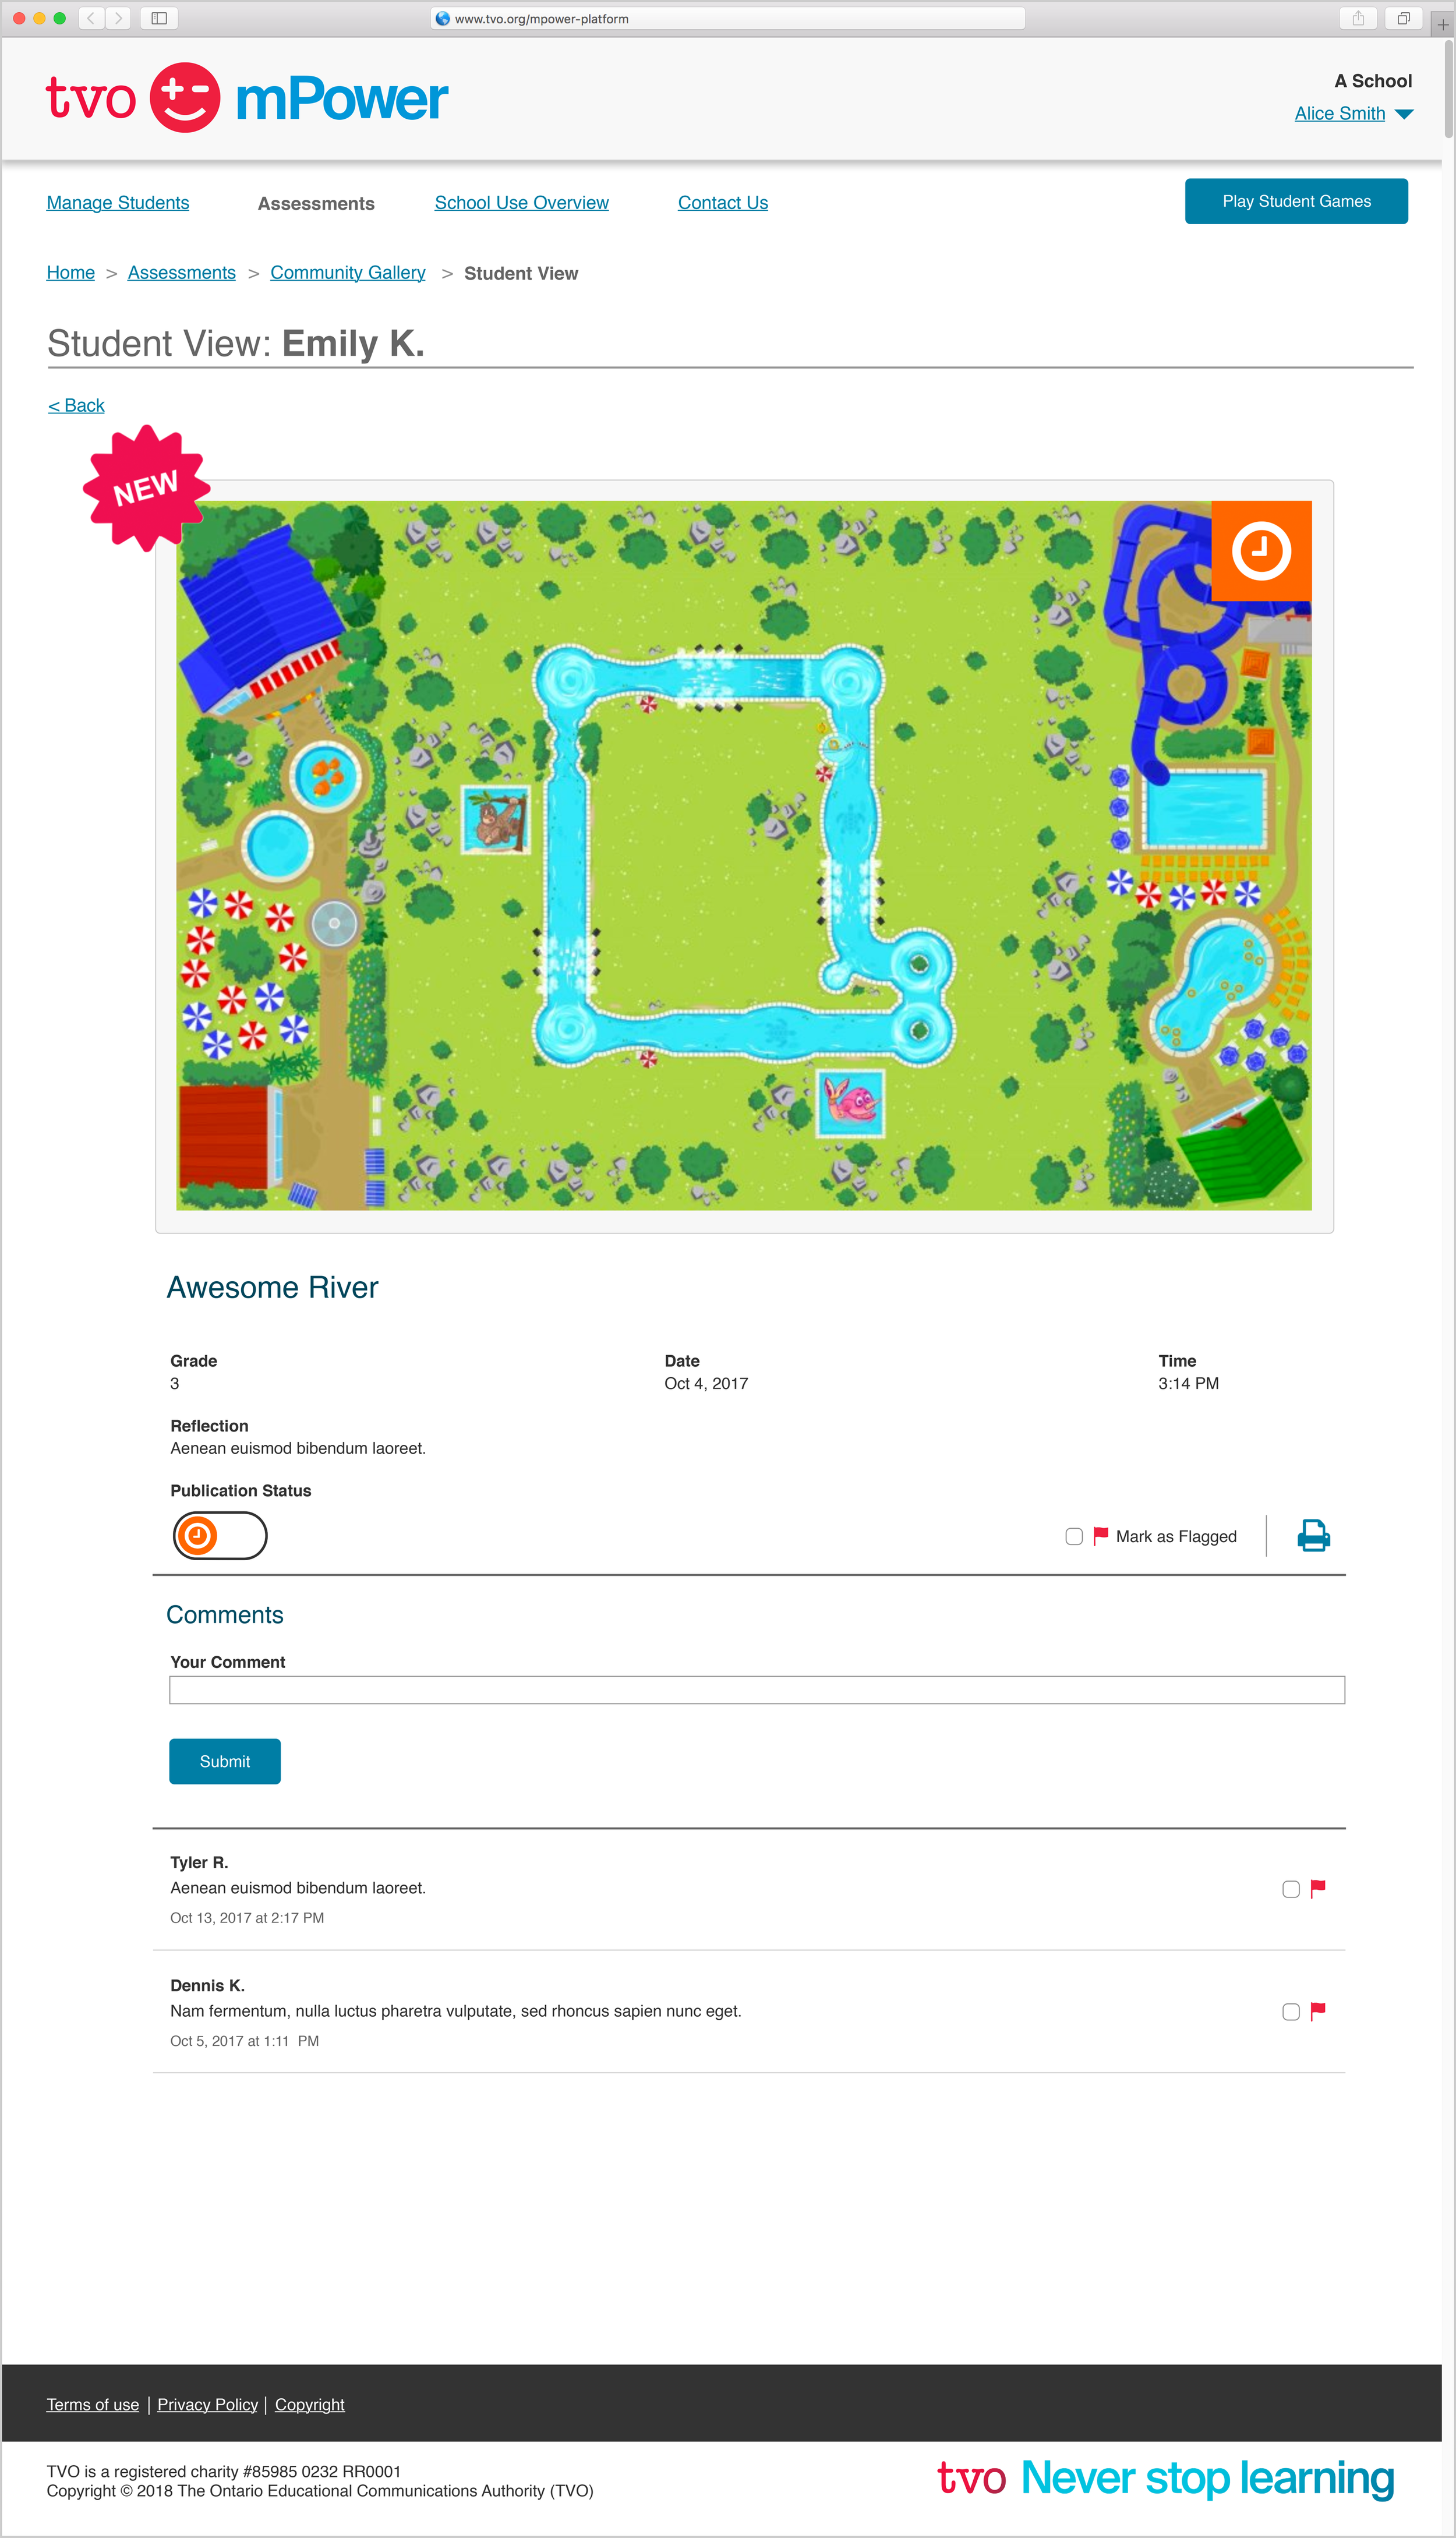
1.1 - Assessments: Community Gallery Student Post
The user opens a student post from a Community Gallery. They have the option to flag, comment or delete it.
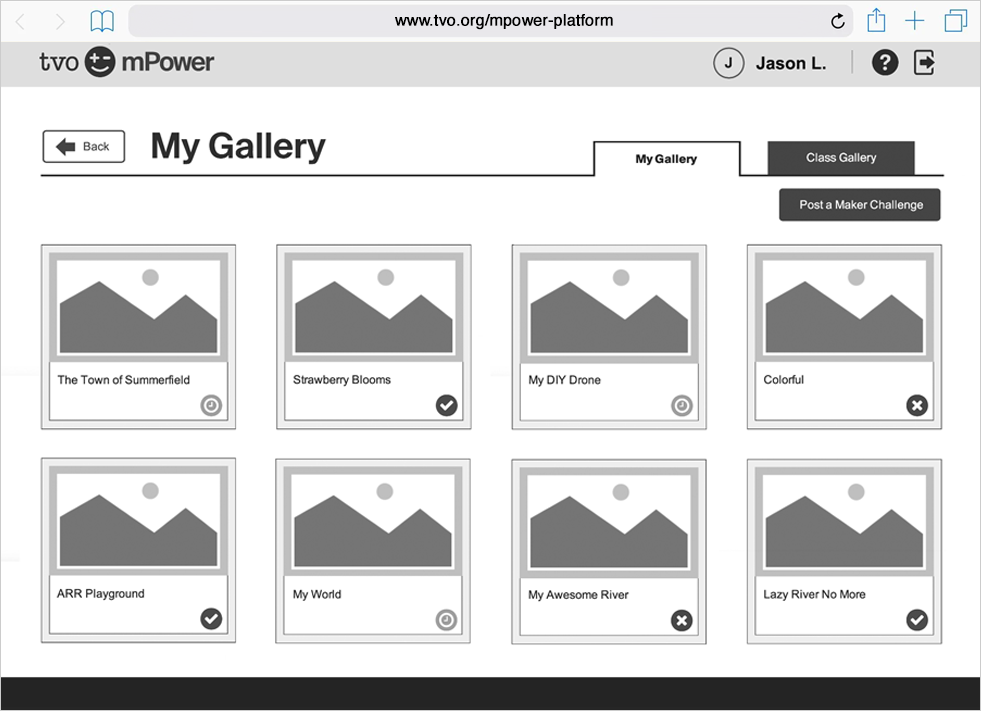
Wireframes & Hi-Fidelity Mockups for Student Community Gallery: The wireframes specs (left) guided the TVOKids team in creating the hi-fidelity mockups (right)
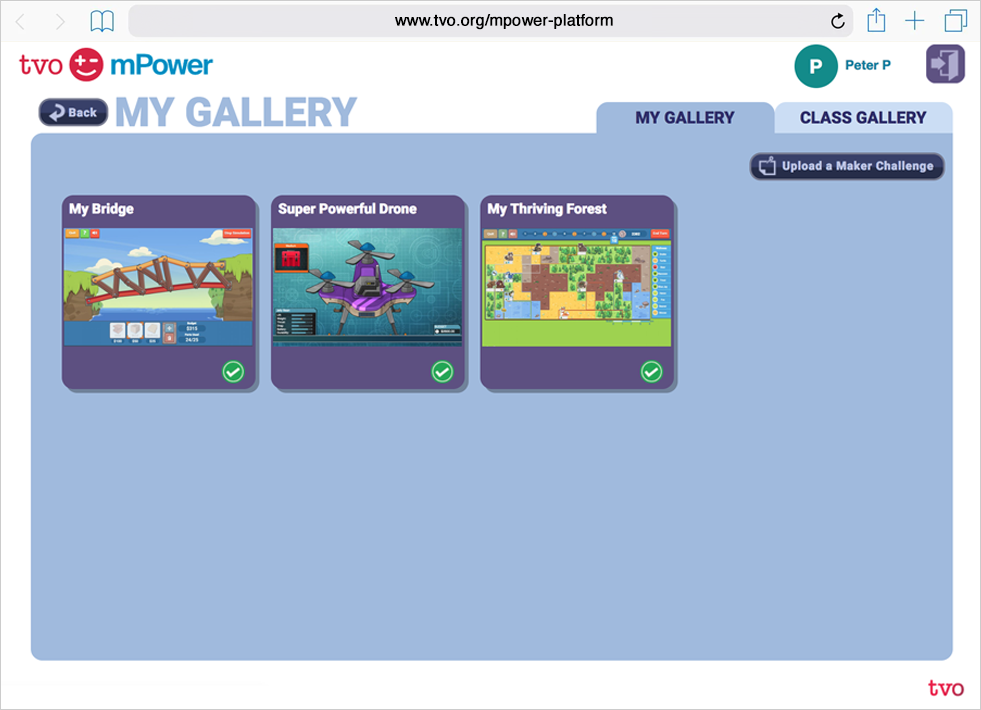
1.0 - My Gallery
The student sees their own Gallery posts.
Wireframe
Mockup
1.1 - My Gallery Post
Student selected their to view, edit and/or share feedback.
Wireframe

Mockup

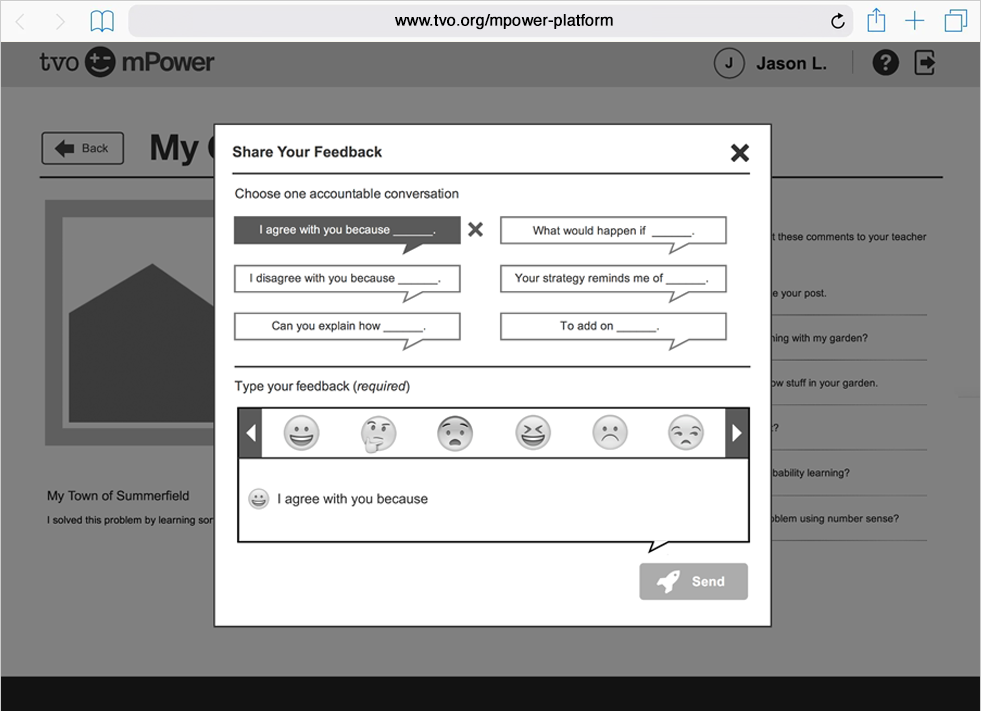
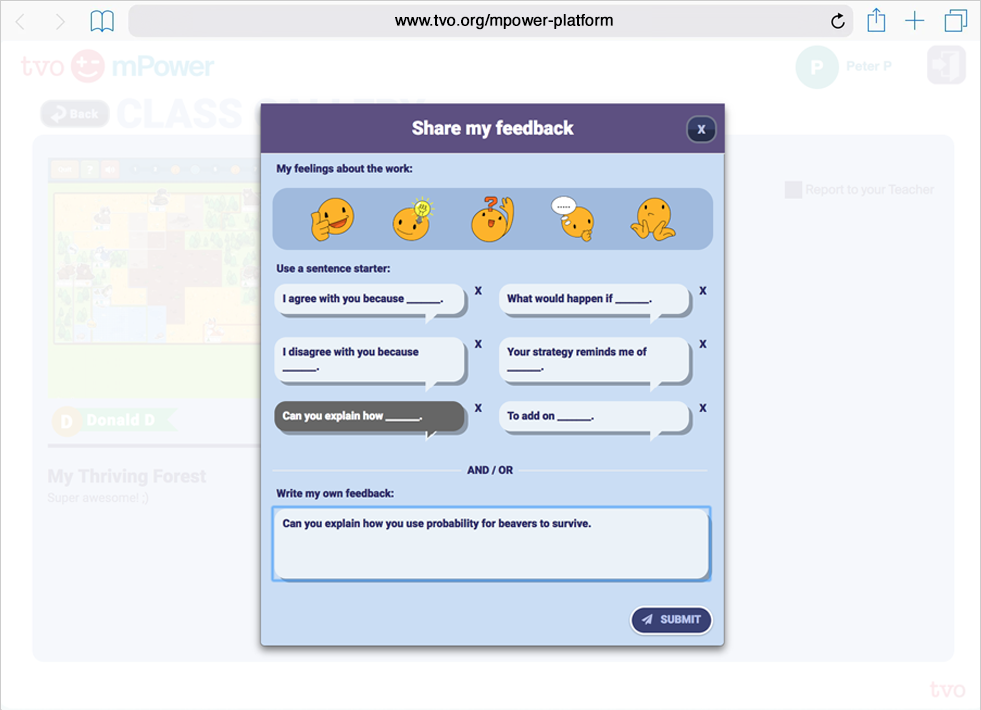
1.2 - My Gallery Share Feedback
Student shares feedback by choosing an emoticon, accountable conversation or by typing.
Wireframe
Mockup
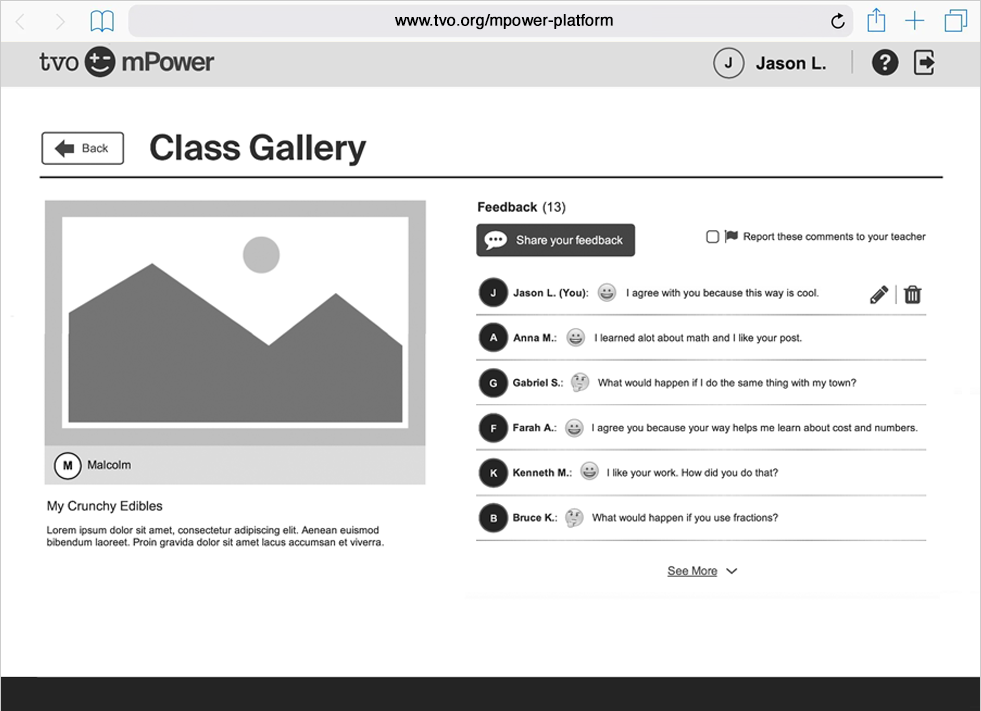
1.1 - Class Gallery
The student sees their Class Gallery posts.
Wireframe

Mockup

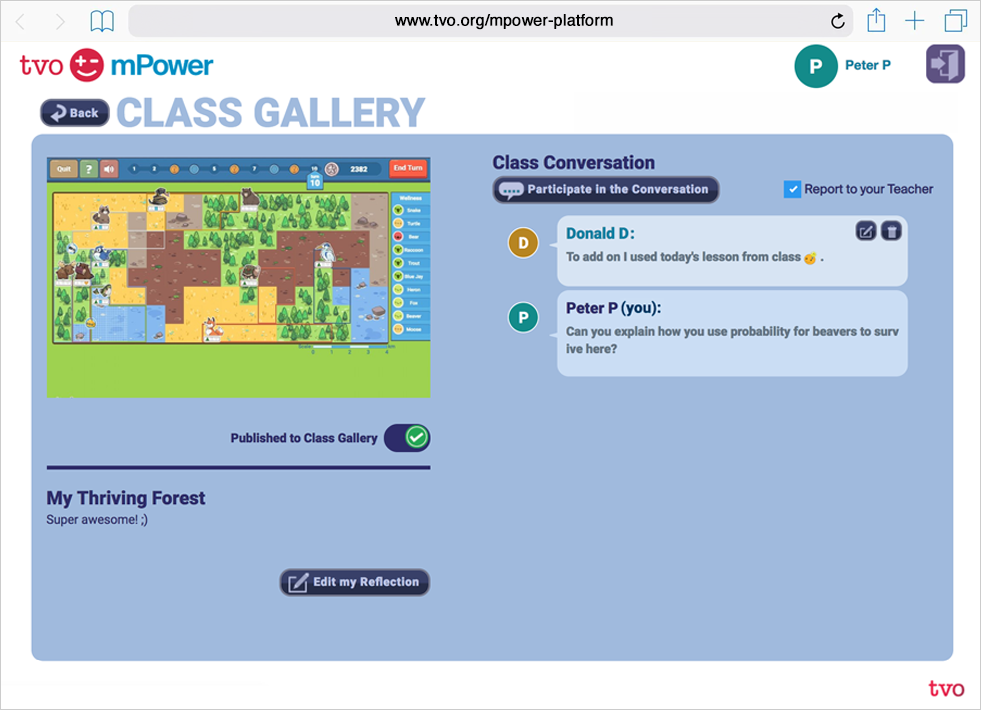
Class Gallery Post
Student selected their class post to view, edit and/or share feedback.
Wireframes
Mockup
Note:
The mockups shown on the right were designed by Stanley Iu (TVOKids Illustrator and Graphic Designer)
4 - Validate
Validating our designs through Playtesting
We needed to ensure that the end-users knew how to interact with the new design. So we took the wireframes and conducted some usability Playtesting sessions. Based on their candid feedback that addressed a few of their pain points, I went back to the drawing board and iterated my designs constantly after 3 rounds of testing. Also, I often met with the developers to work around our technical constraints and iterated my wireframes based on their suggestions to the point that it is ready to roll out to the public.
Complying to accessibility standards with the QA Analysts through an audit report
Another requirement that was part of the validating process was preparing an accessibility audit report with the QA Analysts . It was vital that design elements comply with AODA/WCAG 2.0 standards because it is mandated by the organization and the *Government of Ontario to accommodate users with disabilities. The iteration and testing stages confirmed the requirements and quality standards before each product deployment.
*TVO is operated by the Ontario Educational Communications Authority, which is a Crown corporation owned by the Government of Ontario.
The highest and lowest points of this experience
After many change requests addressed from the pain points of the play testing sessions with the students, it wasn’t as easy as I expected it to be when I came on board. I learned that designing interfaces for children involved a completely different ball game. For example, UI elements, images, symbols, interactions and the use of language needed to coincide with their level of development and comprehension, as well as complement their behavioural needs to experiment, challenge themselves and have fun. Despite the challenges and roadblocks that I faced when designing for a different demographic, I considered this experience educational overall. Also, it was personally fulfilling and rewarding in a way that I was able to develop an empathetic connection with young users.
I had the opportunity to work with and learn from a team of talented and bright professionals and experienced teachers who guided and encouraged me to deliver my work with quality. Our cooperation and hard work have paid off based on the following evidence:
Provided learning solutions as per TVO’s strategic business direction by engaging and exceeding the number of users by 20-25% against the targeted goal.
During a TeachOntario virtual conference, a teacher commented that “the design layout of the reports gave a clear and simple assessment of the student’s performance.”
*Resources:
The Iconography of Sharing (Available online at medium.com)
Sesame Street Framework for School Readiness, page 43 (Available online at sesameworkshop.org)
Credits to my team
Credit goes to the Product (Atiya Sobhan, Bill Lee, Cara Yarzab, Dillon Li, Ken Wong, Kit Tang), TVOKids (Andrea Luc, Jessica McLaughlin, Mara Shaughnessy, Stanley Iu), Project Manager (Phillip Leung), Web and Mobile Development (Danielle Keith, Derek Turney, Lesley Earle) teams, including our educator stakeholder (Katina Papulkas).